Revenue Analysis Dashboard - Overview
Project Information
- Category: Data Analytics
- Client:Personal Project
- Project Date:July 2024
- Tools Used:Excel
- Data Source:Supermarket Sales Dataset
- Project URL: View Live Dashboard
Revenue Analysis Dashboard: Driving Revenue Across Stores and Cities
Executive Summary
This is a Revenue Analysis Dashboard designed using Microsoft Excel to analyze supermarket sales data. It explores business performance through interactive visualization and data-driven storytelling, highlighting sales patterns, product performance, customer segmentation, and gender-based revenue trends.
Project Objectives: What I Aimed to Achieve
My primary goals for developing this dashboard were straightforward and focused on business impact:
- Developed a comprehensive revenue performance dashboard that consolidates key business metrics total revenue, quantity sold, and product line counts enabling management to track financial performance at a glance.
- Identified top performing product categories such as Food & Beverages and Sports & Travel, providing data-backed insights for inventory optimization and sales strategy refinement.
- Analyzed payment and customer segmentation trends, showing that cash, credit card, and e-wallet payments contribute nearly equally to total revenue, and that member customers generate slightly higher revenue than normal customers.
- Revealed gender-based revenue contributions, highlighting that female customers account for a larger revenue share — a key insight for targeted marketing and product development strategies.
Dashboard Overview: Key Insights from Unfiltered Data
This dashboard is designed for highly interactive and dynamic exploration, focusing on actionable revenue-centric insights. Let's walk through the key components and what they tell us, specifically looking at the unfiltered data:
- Overview of the Revenue Analysis Dashboard:
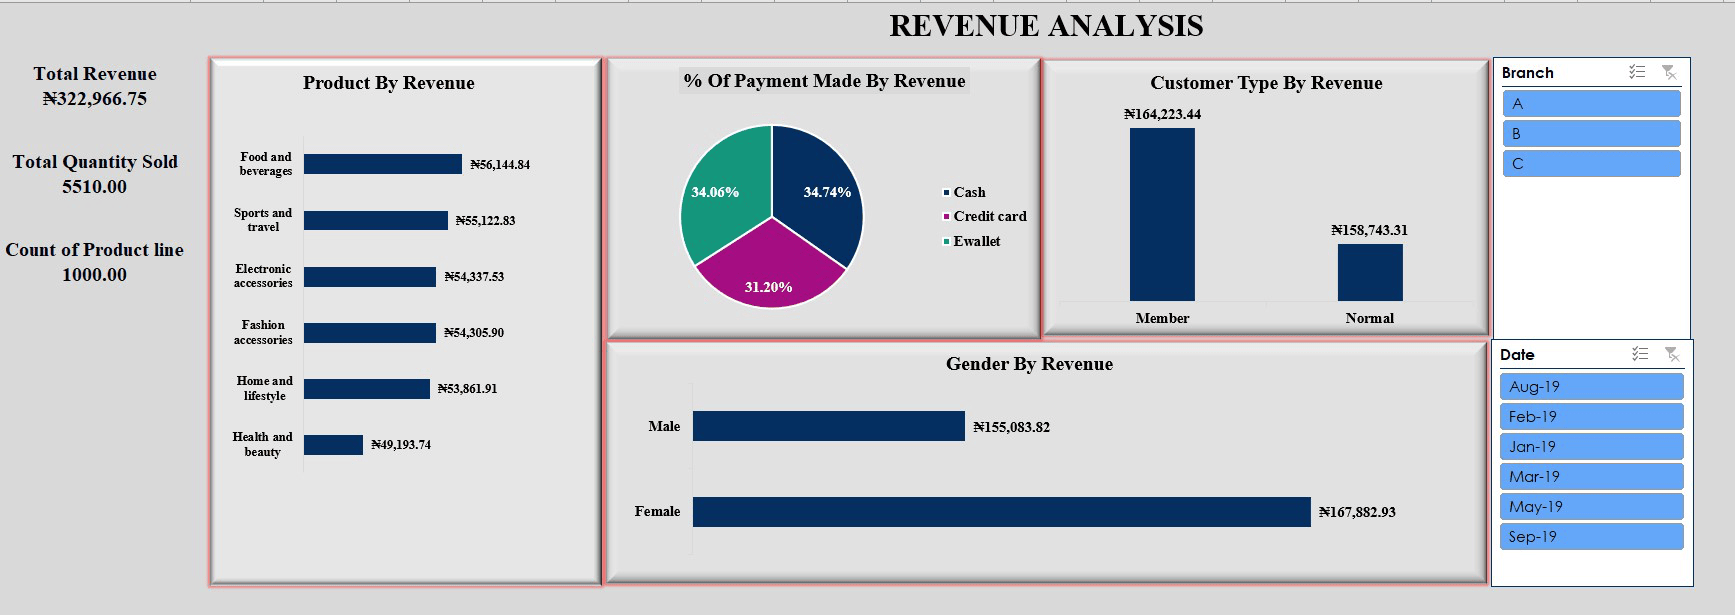
- The Revenue Analysis Dashboard provides a holistic view of business performance across multiple dimensions including revenue, customer segmentation, product performance, and payment channels.
- The "Previous Month Revenue" is currently $0.00, indicating a cumulative view without a prior period selected for comparison. Both Total Revenue and Previous Month Revenue dynamically change color to provide immediate visual feedback on performance trends (e.g., green for positive, red for negative, or based on comparison).
- Comprehensive Revenue Performance Tracking Overview:
- The dashboard presents total revenue, total quantity sold, and product line count, giving a snapshot of business performance across all branches.
- It enables quick comparison of revenue over time, helping management identify growth opportunities and seasonal sales trends.
- Product Category Performance Insight:
- Top revenue-generating categories such as Food & Beverages and Sports & Travel demonstrate strong consumer demand, contributing significantly to total sales.
- Lower-performing categories like Health & Beauty signal areas where marketing or product placement strategies could be improved.
- Customer and Payment Segmentation Analysis:
- Payment distribution shows a near-even split between cash, credit card, and e-wallet methods indicating customer flexibility and a balanced payment ecosystem.
- Member customers contributed slightly higher total revenue than non members, emphasizing the business value of loyalty programs.
- Gender-Based Revenue Contribution:
- Female customers generated a higher revenue share (₦167,882.93) compared to male customers (₦155,083.82), suggesting stronger purchasing engagement among women..
- This insight supports more focused marketing and promotional campaigns targeting high-value demographic groups.
- Interactive Filters: The dashboard includes dynamic slicers for Branch and Date, enabling users to filter and view insights specific to each business location and reporting period..
- Total Revenue (₦322,966.75): Serves as the primary financial indicator of business performance, reflecting total earnings across all products and branches.
Tools and Technology
This dashboard was developed using Microsoft Excel
- Integrate Real-Time Data Feeds: Connect the dashboard to a live data source (e.g., SQL Server or an ERP system) to enable real time tracking of sales and revenue performance across all branches, improving decision responsiveness.
- Enhance Visual Storytelling with Advanced KPIs: ntroduce dynamic metrics such as Month-over-Month Growth, Average Revenue per Customer, and Branch Performance Index to provide deeper business insights beyond static totals.
- Implement Drill-Through and Hierarchical Analysis: Enable users to click through visuals (e.g., from product categories to individual items or transactions) for granular insights, improving interactivity and analytical depth
- Automate Scheduled Reporting and Alerts: Incorporate automated email or Power BI service alerts to notify management of performance deviations or revenue anomalies, ensuring proactive decision-making.
- Enhanced Revenue Visibility: Provided a centralized view of total revenue streams across product categories, branches, and customer segments enabling data-driven decision-making and performance tracking at a glance.
- Optimized Sales Strategy: Identified top-performing products and payment methods, helping the business prioritize profitable categories and streamline marketing and inventory strategies.
- Improved Customer Insights: Analyzed customer behavior by gender and membership type to uncover spending patterns and loyalty trends, supporting more targeted engagement and retention strategies.
- Data Driven Operational Efficiency: Empowered management with interactive filters and real-time metrics to monitor revenue by branch and period, reducing manual reporting time and improving agility in business planning.
Recommendations for Driving Revenue Growth
Based on the insights derived from this dashboard, here are key recommendations to optimize sales performance:
Business Value and Impact: Why This Matters
This Revenue Analysis Dashboard offers significant, tangible value to a retail business by:
Conclusion
Revenue Analysis Dashboard shows clear patterns in customer demographics, product preferences, and payment behaviors. This structured PPDAC approach demonstrates how simple Excel analytics can reveal business insights bridging the gap between raw data and informed decision making. Thank you.